
Key metrics overview.
The world of business analytics is filled with lots of technical jargon. What are key metrics and other terms used in business analytics? There are hundreds of metrics to measure various aspects of business activity. If you are new to business metrics, some of the jargon used may sound like alien dialect.
Below, we answer the question “What are key metrics?” and help you understand the role they play in the successful running of a business.
What Are Key Metrics in Business?
A key metric is also known as a key performance indicator or KPI. Key performance indicators are used by businesses to track their progress towards a goal. But, of course, that begs the question – what are key performance indicators? Well, KPIs are a lot like your heart rate, blood pressure, and BMI when you visit the doctor. They are pointers and measurements of your overall health. Tracking their changes over time can help point to larger problems that may not be immediately apparent.
It is also important to note that organizations differ in their priorities – what is key metrics for one company isn’t necessarily key metrics for another.
What is KPI?
What does KPI mean? Indeed, what does KPI stand for? KPI is the abbreviation for Key Performance Indicators.
So, what is KPI in business? KPI in business refers to the key metrics that let management assess the performance of areas critical to business success.
Types of Key Metrics
Now that we have covered what is KPI mean, let’s consider the different metrics to help you understand what key metrics are. KPIs can either be focused on drivers (lagging indicators) or outcomes (leading indicators) and must be quantifiable.
- Leading Indicators: KPIs focused on drivers are known as leading indicators. Leading indicators provide information on activities that drive outcomes. Measuring driver KPIs delivers a deeper understanding of the impact specific policies and processes have on organizational performance.
- Lagging Indicators: Lagging indicators provide information on events that have already happened. By tracking these over time, a business can understand what leads to specific outcomes.
The table below summarizes how KPIs can either be focused on drivers or outcomes.
Examples of Leading Indicators
Below are a few examples of what are key metrics with regard to leading KPIs in business:
- % Growth in New Markets: Finding new markets for goods and services is a critical long-term strategy for all businesses. In this case, the market could be an entire industry, a line of products, or a single product. This metric shows how sales have grown in the new market compared to a previous period.
- % Growth in Sales Pipeline: Every business relies on a steady stream of leads to increase sales. In the world of sales, leads are to a salesperson what blood is to the body. Without leads, there are no sales, and soon the business starts struggling to meet revenue targets. The % growth in the sales pipeline is a critical KPI that shows management the increase in leads compared to a previous period. It provides management with actionable intelligence. When the growth is negative or fails to meet the intended target, management can take the appropriate interventions such as retraining or reprimanding.
- Employee retention rate: Losing skilled employees is expensive. Finding, onboarding, and training their replacements is even more costly. According to The Society for Human Resource Management (SHRM), a salaried employee’s average replacement cost is six to nine months’ salary. Some other studies have found this figure to be higher, in some cases as high as twice the annual salary, especially for high-earning employees. Good employee retention drives growth as the company spends less time and resources recruiting and training.
- Employee satisfaction rate: Employee satisfaction measures overall staff satisfaction with their jobs. Satisfied workers deliver more value to an organization.
- Lead conversion ratio: This measures the ratios of leads who have been successfully converted to be paying customers. It is a great metric to help a business establish the baseline needed for a promising sales pipeline.
- Lead to opportunity ratio: This business metric measures the ratio of prospects that have turned out to be good leads based on its lead scoring parameters. It is a useful metric to let the sales team know whether they are prospecting in the right markets.
- The Number of New Patents: Innovation is key to the success of enterprises. The number of new patents registered is a vital metric that’s proof of continuous innovation. Big tech firms such as Microsoft and IBM have survived for decades due to innovation. For example, 9,262 patents were assigned to IBM in 2019, making it the company with the most patents.
- The Number of New Website Trials: This applies to Software as a Service (SaaS) companies and other businesses that offer free trials for their products. The more free trials taken up, the higher the likelihood to convert them into paying customers. Therefore, this leading indicator helps business managers predict future sales.
- The Number of Unique Website Views: The majority of businesses have a website. According to etailinsights, There are 7.1 Million companies that sell products online in the world. Websites are often the first contact a company has with potential customers. Though not in all industries, the number of unique website visits is an indicator of interest in its products. The number of unique website views is also a leading indicator of general business health for companies that sell through their websites.
Examples of Lagging Indicators
Below are a few examples of what are key metrics with regard to lagging KPIs in business:
- Conversion Rate: Many people may be interested in your product – what matters most, however, is whether you convert interested people into paying customers. Your marketing efforts need to convert leads to paying customers. The conversion rate is an excellent measure of your marketing campaign success – the higher it is, the better. A low conversion rate may indicate that the marketing campaign is deficient at convincing potential leads.
- EBITDA: This is abbreviation refers to Earnings Before Interest, Tax, Depreciation, and Amortization. It is arrived at by deducting tax, depreciation, and amortization from the net profit margin.
- Gross Margin: This metric is the sum of all income from product sales minus the cost of producing the goods. The result is then divided by the sales revenue to come up with a percentage. It demonstrates the efficiency of a company at using its investment to deliver a profit.
- Growth in Annual Sales: This metric indicates the increase or decrease in the company’s sales revenue annually.
- Net Profit Margin: This metric shows the profit earned after deducting fixed costs such as labor, rent, utilities, and other sales expenses.
- Operating profit margin: This metric looks at the profit a company earns before deducting income taxes and interest. It is the ratio of operating income to revenue and expressed as a percentage – the higher the figure, the better for the business. A high operating profit margin gives you the leeway to price your goods or services slightly lower than the competition. You can compete on price in the market. You can also pay the interest on loans with ease. For managers, a high operating profit margin is a sign you can survive tough times. When the market tumbles, you can weather the storm.
- Qualified Leads: A qualified lead is a lagging indicator for a marketing department. This is anyone who fits the profile of the buyer persona you are targeting. A high number of qualified leads is better than increasing the number of total leads (including the unqualified). For instance, if you have ten leads and eight are qualified, you are on the right track. Qualified leads have a high likelihood of buying your product. Qualified leads indicate you have narrowed your efforts to the people who truly matter.
- Return on Assets: This business metric is an indicator of profitability relative to the assets. A high ROA demonstrates that management is efficient at using assets to generate income. The benchmark differs in every industry, so it is always best to compare competitors in the same industry. To compute ROA, divide the net income by the total assets and multiply by 100 to get the percentage.
- Return on Equity (ROE): ROE is presented as a percentage of net income to shareholders’ funds. Many investors look at ROE to decide whether to purchase a stock. Investments analysts also use this figure to recommend stocks to investors. A high return on equity means a company is an excellent investment. It can fund its operations and ventures without relying on external funds.
- Return on Invested Capital (ROIC): This figure represents the return on all invested funds. All the capital accessed by a business, including the shareholders’ funds, is included as invested capital. The invested capital includes corporate bonds and commercial loans. To compute ROIC, divide the net profit after tax by the invested capital and multiply by 100 to get a percentage. Ideally, ROIC should be greater than the company’s weighted average cost of capital. If it’s lower, then the business is considered a value destroyer.
- Sales Revenue: This is the sum of all income from product/service sales minus the returned products’ cost. It forms a historical record of performance.
Different Approaches to Applying KPI
To further your knowledge of what are key metrics, let’s now consider the different approaches to applying KPIs. There are two primary ways of applying KPIs in an organization.
1. Linking KPIs Throughout the Organization
In the first method, KPIs are linked throughout the organization without using any performance management methodology, as illustrated in the example below for an apparel manufacturer.
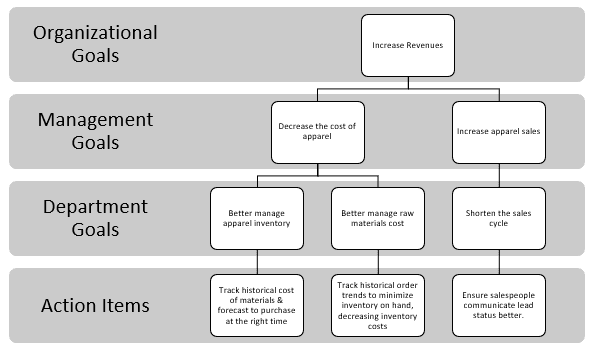
The problem with this approach is that without a more formal methodology, a business can lose sight of key metrics’ drivers and outcomes.
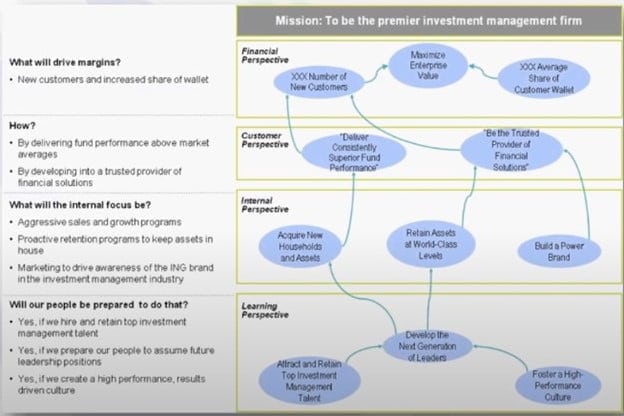
1. Using a Balanced Scorecard Performance Management Methodology
In this second approach, managers ask themselves what are key metrics in their business and then use key performance indicators within a strategy map. This leads to a more formal linkage between drivers and outcomes. Below is an example of how an investment manager would use this approach to apply KPIs.
With all these different key metrics relying on data as their driver, it is important to have a framework that allows you to collect, measure, manage, and analyze data. In an organization, data is found in various applications, from a general ledger or customer relationship management (CRM) system through to other external sources. These can be fed through multiple technologies into a data warehouse where it is aggregated in one central location before flowing into relational and multi-dimensional data marts (a structure/access pattern distinct to data warehouse environments, used to retrieve customer-facing data). These then feed the data into a number of applications before being sent to users in a meaningful format. These user interfaces act as a bridge between the heaps of raw data and analyzing the data.
Examples of user interfaces include the MS Office suite of products, browsers, and cloud dashboard applications. These provide several formats to access and analyze data from highly formatted canned reports to dashboards, guided analysis, and ad-hoc analysis, allowing for on-demand report creation and data discovery of what are key metrics. Many of these platforms also allow for key metrics reporting and analytics.


